Wednesday, April 13, 2011

Paper Structure

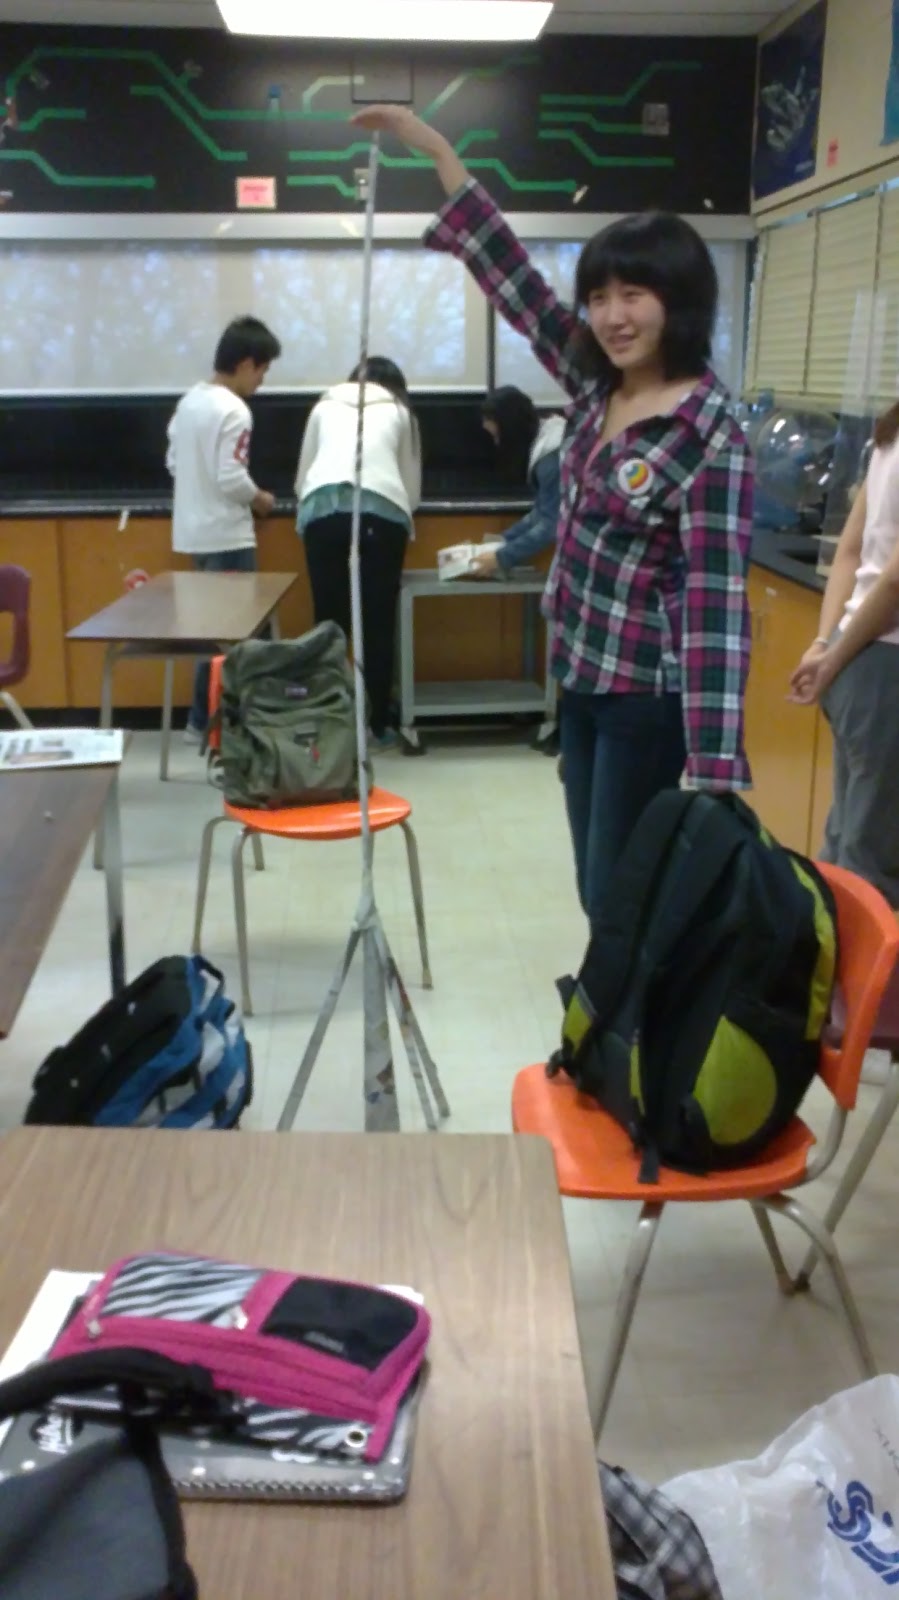
Today, we made a free-standing paper structure out of some scotch tape and 3 sheets of newspaper.


193 cm tall 

We made a base similar to a tripod, except the middle part also touches the ground. We focused the center of gravity at the base and luckily, the base was enough to withstand the weight of the entire structure. However, the top of our structure was bending a slight bit. 
Unfortunately, our structure was off by 10 centimeters from the winning group. We should have saved some tape and stuck it at the top. Lol.

Tuesday, April 12, 2011

Tall Structures

An example of an extremely tall structure is the....


CN TOWER!!
The CN Tower was the world's tallest free-standing structure from 1975-2007. 

Currently, the world's tallest building is the Burj Khalifa in Dubai

So how were these towers and buildings built so tall without tipping over?

(1) Low center of gravity (near the ground)
(2) Shape of a triangle/ pyramid/ cone (where the weight it mostly at the bottom, little weight at the top)
(3) Wider the base, the more stable the structure
(4) Have holes in the structure where it isn't necessary to cover (acting like arches) - reduces weight but carries same amount of mass
(5) Structure's base is flat - therefore balanced base
(6) Strong support/ beams, etc.

Tuesday, April 5, 2011

Projectile Motion

The 5 graphs below show the 5 cases of projectile motion.
(1) The object is thrown downwards to the ground
(2) The object is throw upwards to higher elevation and gets caught
(3) The object is thrown into the air from the ground and eventually falls back down to the ground, further away from where the object originally stood
(4) The object is thrown from the ground, reaches the peak, and falls down slightly, getting caught in mid-air
(5) The object is thrown up from mid-air and falls to the ground


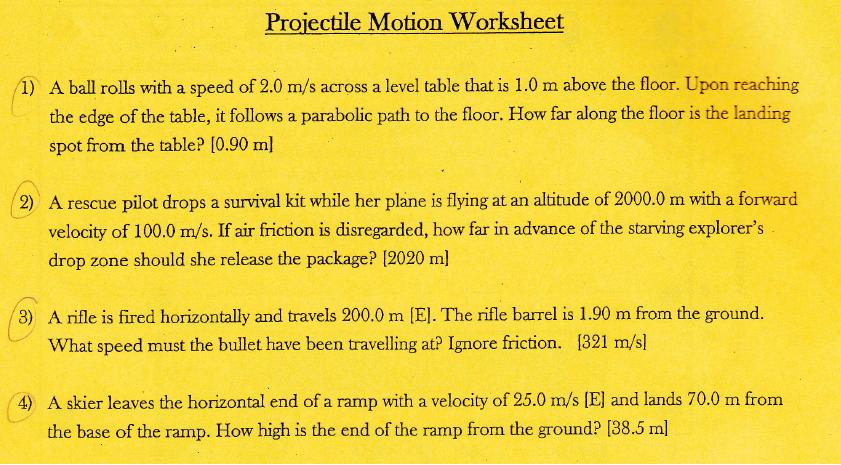
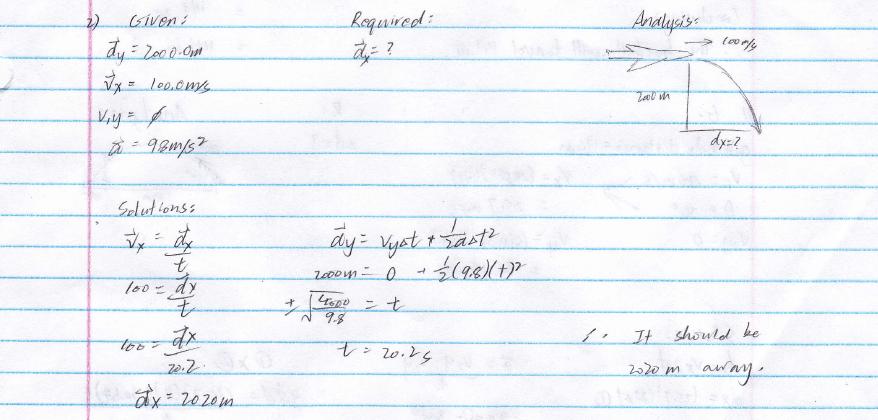
And below are the projectile motion questions....


Monday, March 28, 2011

Aerodynamics

Principles:
- A glider moves through the air without the help of a motor or engine
- A glider can move through air and descend gently

Facts:
- Design of wing and glider body has a major contribution to how it glides in the air
- Adding some weight to parts of glider will help it stay up in the air, have lift, and travel in a straight path (rather than spinning or nosediving)


This is a basic glider (paper airplane)

So how does it fly??

In flight, the glider has three forces acting on it (compared to the four forces that act on a powered aircraft). Lift, drag, and weight (since there is no engine for there to be thrust).


In order for the glider to fly, it must generate lift to oppose its weight. To generate a lift, a glider must move through the air. However, there is no thrust to oppose the drag as the glider moves through the air, therefore a glider quickly slows down until it can no longer generate enough lift to oppose its weight.

Even though a glider does not have thrust during flight, it has an initial velocity (coming from the person exerting force upon the glider [throwing the aircraft]). That's where the velocity needed to drive the aircraft comes from.

For a glider to remain up in the sky for a long time, it must be efficient and pass over any nearby updrafts (rising air).


Sunday, March 27, 2011

Physics Textbook Homework


For some reason, blogger rejected the direct PDF file from my scanner. Therefore, I had to resort to ugly screen shots D:


Monday, March 21, 2011

Walking the Graph

Results
The following graphs show the relationship between position in meters (m) and time in seconds (s) with time as the independent variable (Graph 1 & 2).


Graph 1

Graph 1 shows the displacement over 10 seconds for the above graph. It can be derived from Graph 1 that the object stays still 1 meter away from the origin for 1 second. Then it moves at a constant velocity for 2 seconds until it is 2.5 meters away from the origin and stops 2.5 meters away from the origin for 3 seconds. After, the object moves 1 meter toward the origin at a constant velocity for approximately 1.5 seconds, and the object stops 1.75 meters away from the origin for 2.5 seconds.

Graph 2
Graph 2 shows the displacement over 10 seconds for the above graph. It can be derived from Graph 2 that the object moves 1.5 meters toward the origin at a constant velocity for 3 seconds and then stops 1.5 meters away from the origin, for 1 second. Then, the object moves 1 meter toward the origin at a contant velocity for 1 second and stops 0.5 meters away from the origin for 2 seconds. After, the object moves 2.5 meters away from the origin at a constant velocity for 2.5 seconds.

Graph 3

It can be derived from Graph 3 that the object starts off 0.9 meters away from the origin and proceeds to move 0.9 meters away from the origin at a constant velocity for 2.7 seconds. Then, the object stops and remains 1.8 meters away from the origin for 2.6 seconds. After, the object moves 1.5 meters away from the origin for 2.7 seconds.


The following graphs display the relationship between velocity (in meters (m)/seconds (s)) and time in seconds (s).

Graph 4
Graph 4 starts off with a velocity of 0, indicating at 0 seconds, the object is at a halt in front of the motion detector and continues to remain stopped for 2 seconds. By 2 second, the velocity suddenly shifts to 0.5m/s over the span of 3 seconds, indicating the object is moving away from the origin at a constant velocity of 0.5m/s. Then, the object quickly stops in 0.1 seconds and remains still for 2 seconds until it suddenly starts moving again towards the origin at a constant velocity of 0.5m/s, due to the line extending into the negative quadrant.

Graph 5
Graph 5 begins with a velocity of 0m/s with the object moving increasing faster and further away from the origin for 4 seconds, reaching a peak of 0.5m/s. At 4 seconds, the object moves at a constant velocity of 0.5m/s for 2 seconds before it suddenly moves toward the origin at a constant velocity of 0.4m/s for 9s and then stops for 1 second.  

Tuesday, March 8, 2011

First Ever Kinematics Lab

Today, our physics class did an experiment regarding displacement/ time and velocity/ time. We were to move according to the graphs we were given, to try and match it as well as possible. Unfortunately, in my group, none of our graphs were very accurate but at least it held somewhat of a resemblance to the general trend of the graph. It was a very interesting experience.


The velocity-time graphs were so hard to follow D:!!!

Luckily, one of the velocity graphs was easier to follow.... though some errors occurred at the end....

The distance-time was easier to follow but there were still errors.


Why doesn't the motion detector work properly :(.


By the end, we found the correlation between velocity, displacement, and time.